- Report a small set of metrics: mention rate, share of voice, recommendation rate, and accuracy — each with a confidence interval.
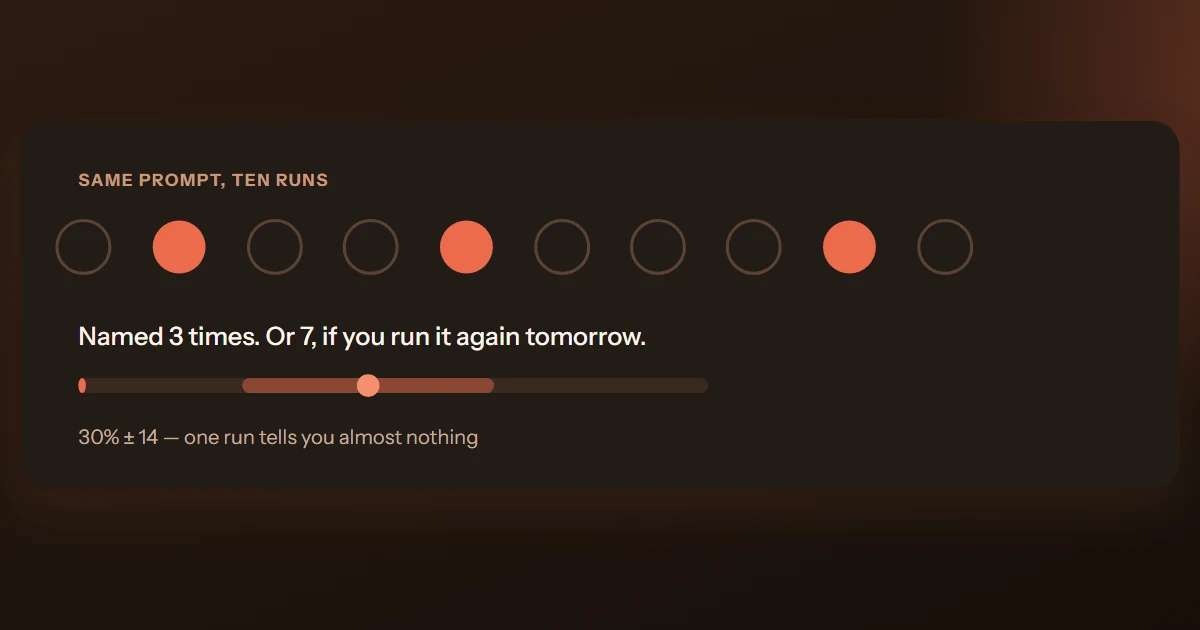
- Every number needs a ±band; without it, normal run-to-run variance looks like performance.2
- Segment by engine and buyer intent — an average across both hides where you’re actually winning or losing.
- Tie movement to actions (what you published) so leadership sees cause, not just a chart.
SEO teams walk into reviews with rankings and traffic. GEO has no equivalent ready-made chart — answers vary run to run and engine to engine. The job is to distill that noise into a few metrics an executive can trust and act on.
The four metrics worth reporting
- Mention rate — how often your brand appears in the answer at all, per engine.
- Share of voice — your mentions as a fraction of all brand mentions in your category.
- Recommendation rate — how often you’re positively recommended, not just named.
- Accuracy — the share of statements about you that are actually true.
That’s the whole core dashboard. Everything else is a drill-down. Resist the urge to add more — four metrics people trust beat twelve they ignore.
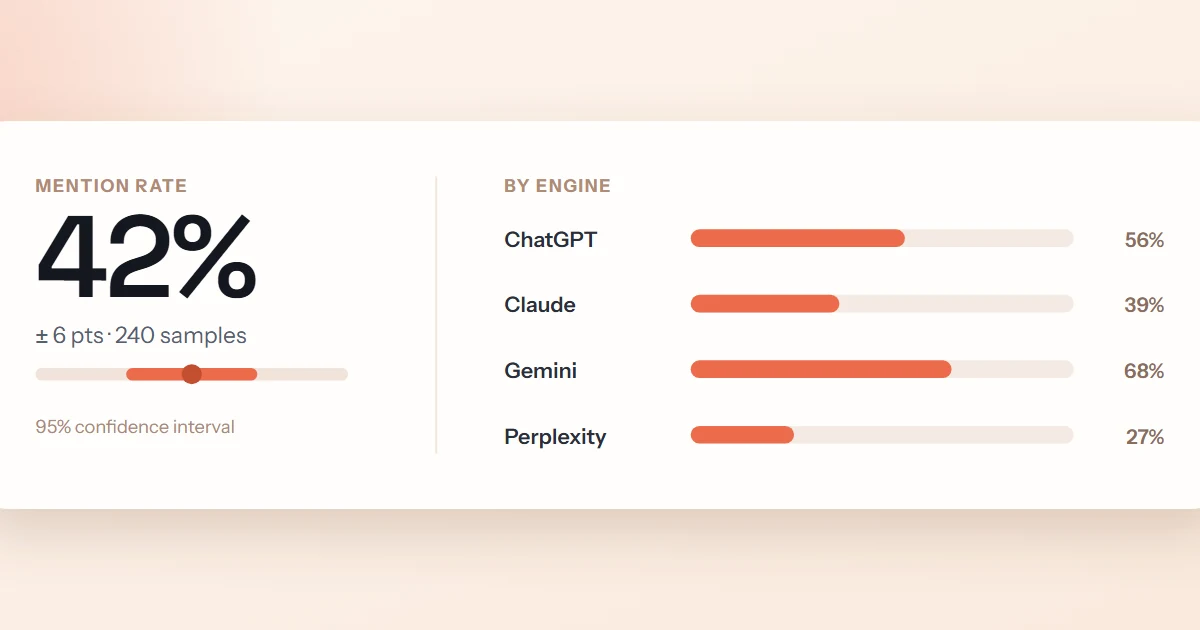
The single most important design choice: put a confidence interval on every number. A mention rate of “54% (±6)” tells a leader when a change is real and when it’s noise. A bare “54%” invites them to celebrate or panic over nothing.
Segment, or the average will lie
A blended 50% mention rate can hide 70% on ChatGPT and 30% on Gemini, or 65% for comparison prompts and 15% for pricing prompts. Report by engine and by buyer intent so the dashboard points at the specific gap to close, not a comforting middle.
| Metric | Report it as | Not as |
|---|---|---|
| Mention rate | 62% (±5), per engine | “We’re doing well on ChatGPT” |
| Share of voice | 31% of category mentions | “Lots of mentions” |
| Recommendation | 22% (±4) | “Usually recommended” |
| Accuracy | 3 open factual errors | “Mostly accurate” |
Connect movement to action
The chart leadership actually wants is cause-and-effect: “we published four comparison pages in week 3; mention rate on comparison prompts rose from 40% to 55%, beyond the confidence band, by week 6.” That framing — baseline, intervention, measured lift — is what turns a dashboard into a budget case.
A GEO dashboard has one job: tell a busy executive what moved, whether it’s real, and what you did to move it.
Vanity metrics to drop
- “Sentiment score” with no interval — unstable and easy to game.
- Single-run screenshots — anecdote dressed as data.
- Raw mention counts without a category denominator — growth in the category looks like your win.
- Blended cross-engine averages presented without the per-engine spread.
Frequently asked questions
Match your measurement cadence — most programs sample weekly or biweekly, which is frequent enough to catch real movement without over-reacting to noise. Report the trend, not the latest single run.
Share of voice, because it’s inherently comparative — it accounts for category growth and rival movement in a single number. Pair it with a confidence interval so nobody mistakes noise for progress.
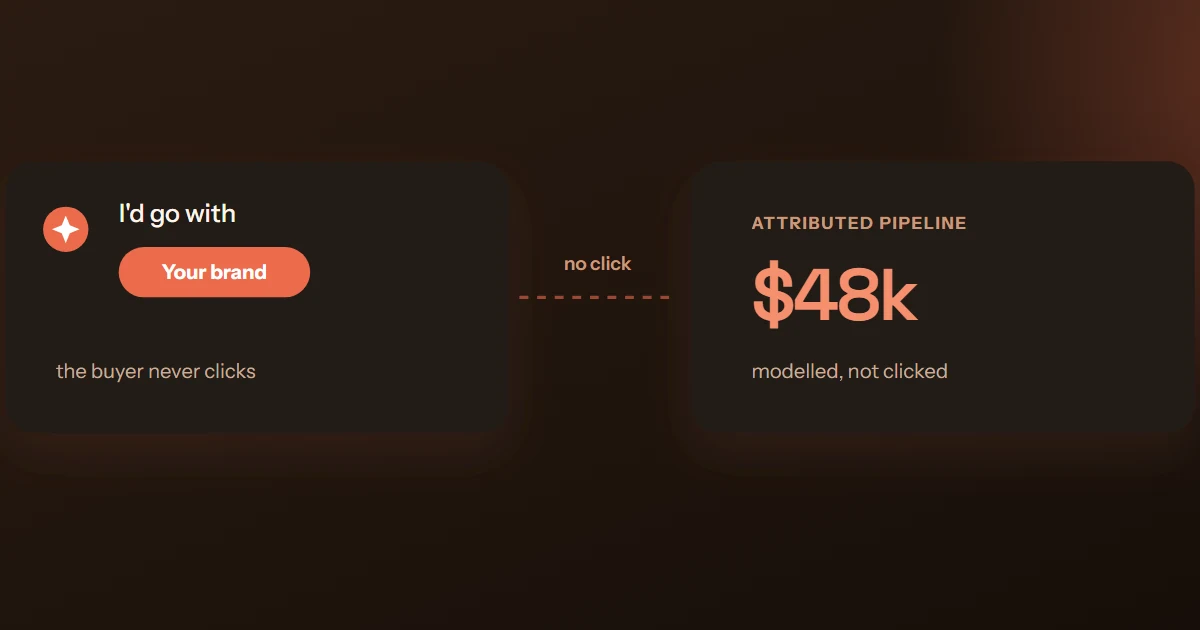
Connect metric movement to specific publishing actions and, where possible, to assistant-referred traffic and pipeline. The credible story is baseline → intervention → measured lift, not a raw number in isolation.
Sources & further reading
- "GEO: Generative Engine Optimization", Aggarwal et al., KDD 2024 / arXiv:2311.09735.
- Pew Research Center — "Google users are less likely to click on links when an AI summary appears", July 2025.
- Gartner — "Search Engine Volume Will Drop 25% by 2026", February 2024.

Head of Research at MentionBeat. Maya leads the measurement methodology behind MentionBeat's visibility metrics — prompt-suite design, sampling, and confidence intervals — and writes about how generative engines choose what to say.