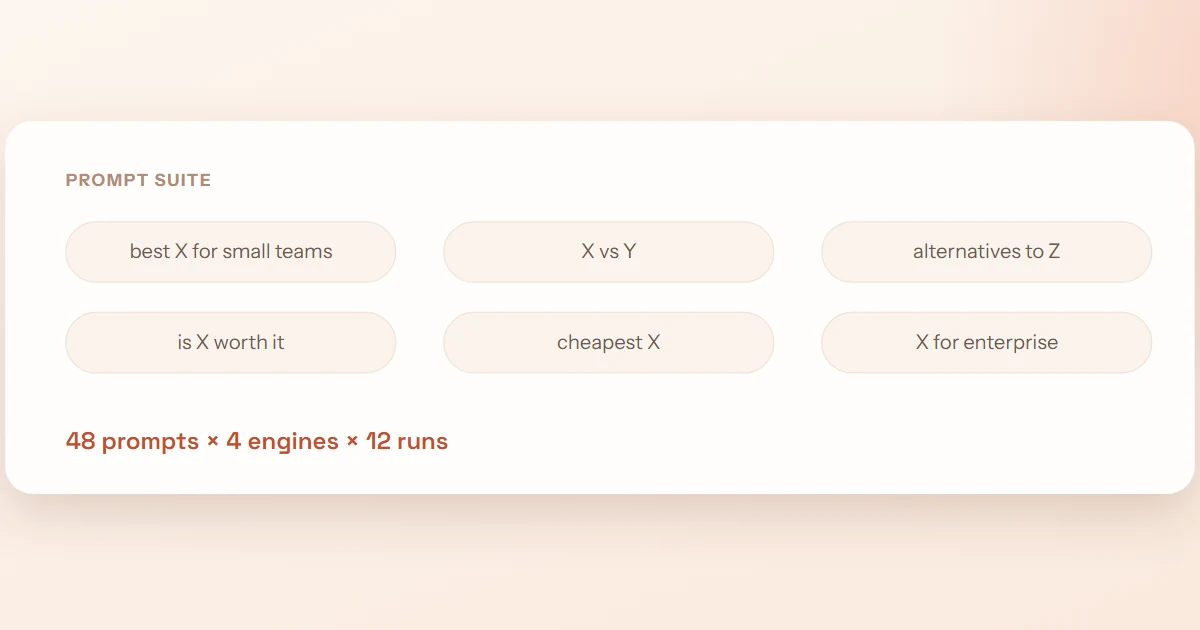
- It's possible — but there's no results page to scrape. AI answers are generated fresh each time, so tracking means sampling: a fixed prompt suite × engines × repeated runs.
- A one-off check is a sample of one. The same prompt can name different brands on different runs, so a single screenshot — reassuring or alarming — proves nothing.
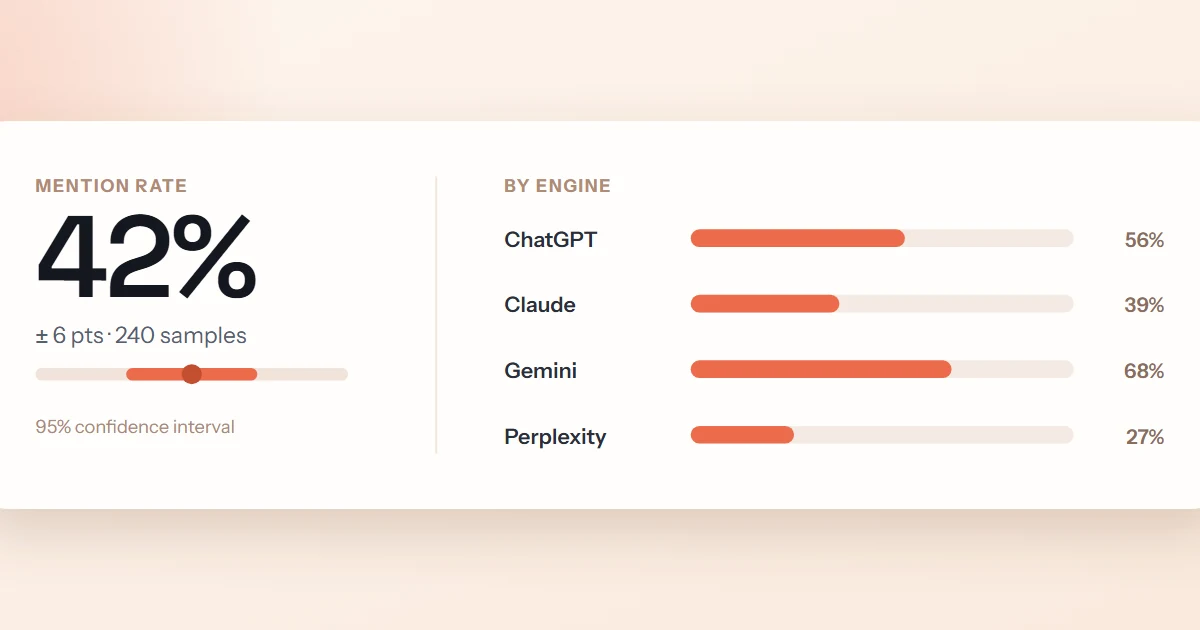
- Count four things: mention rate, share of voice, sentiment and accuracy — each with a sample size and a confidence interval.
- You can start in a spreadsheet this week. Tooling earns its keep when the coding, repetition and statistics outgrow an afternoon per wave.
Type a query into Google and you can see exactly where you rank — screenshot it, put it in a deck, check it again tomorrow. Ask ChatGPT the same question and there's nothing to screenshot that means anything: one answer, generated on the spot, different the next time someone asks. So the question marketers keep typing into search bars is a fair one: is it even possible to track brand mentions in AI search?
It is. But the method looks less like rank tracking and more like polling. You never observe "the" answer, because there isn't one — you estimate how often you appear across many answers. And it's worth doing: Gartner projected traditional search volume falling roughly 25% by 2026 as buyers shift to assistants,2 and Pew found users click a conventional result on only ~8% of visits when an AI summary is present, versus ~15% without one.3 This guide covers why one-off checks mislead, how the sampling method works, what to count, and how to do it yourself in a spreadsheet before you pay anyone — including us.
Why a one-off check misleads
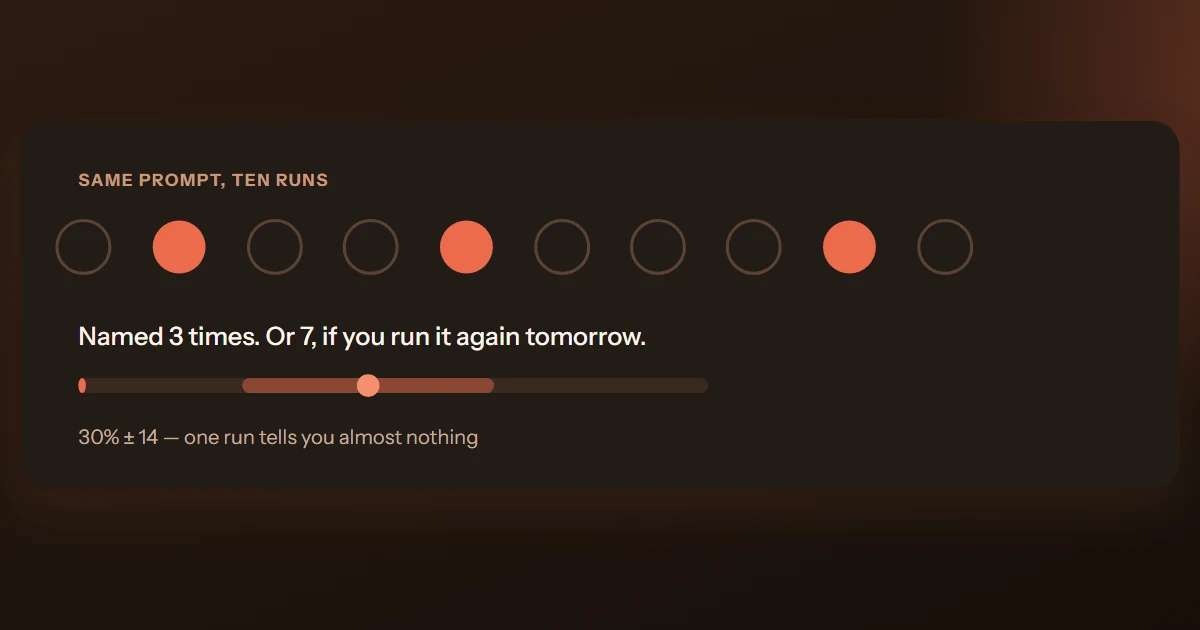
LLM answers are stochastic. Decoding is sampled, retrieval pulls different sources on different runs, and models get updated under your feet without an announcement. Ask an engine "what's the best payroll software for a 20-person company?" ten times and your brand might appear three times — or seven. Neither single run was wrong; each was one draw from a distribution.
That's why the screenshot ritual — someone on the team asks ChatGPT, sees the answer, and either panics or relaxes — produces confident nonsense in both directions. Absence in one answer doesn't mean you're invisible; presence in one answer doesn't mean you're winning. A sample of one has no error bars, and with AI answers the error bars are enormous. We've written up the math separately in why "I asked ChatGPT once" is not a measurement.
One more contaminant: your own history. Logged-in assistants carry memory and personalization, and a marketer who chats about their brand all day will see answers biased toward it. Measure from fresh sessions or the API, never from the account you use for work.
The sampling method: prompts × engines × repeats
Since there's no SERP, you build the observation yourself. Three ingredients:
- A prompt suite. 20–50 questions phrased the way your buyers actually ask — "best CRM for a small agency", "alternatives to [category leader]", "is [category] worth it for a 10-person team?". Crucially, the prompts never name your brand: if you put yourself in the question, the model talks about you and you've graded your own exam. There's a full guide in designing a prompt suite.
- Multiple engines. ChatGPT, Claude, Gemini, Perplexity, Google's AI Overviews and Grok retrieve differently and train on different corpora, so a win on one rarely transfers automatically. Track the ones your buyers use; never average them into one number.
- Repeated runs. Each prompt runs several times per engine. The repeats aren't a nice-to-have — they are the measurement. One run per prompt turns a probability into a coin flip you observed once.
Then freeze the frame. Same suite, same engines, same run counts, on a schedule — so wave two is comparable to wave one, and a change in the number means the world changed, not your method.
The mental model: you're a pollster, not a rank checker. A poll doesn't ask one voter and publish the result — it samples enough people to estimate a rate, and reports the margin of error next to it. Treat AI answers the same way.
What to count once you have the answers
Reading a pile of transcripts isn't a metric. Code each answer and compute rates — the full definitions live in the metrics of AI visibility, but the working set is:
- Mention rate — the share of sampled answers that name your brand at all. Your reach number.
- Share of voice — your mentions as a share of all brand mentions in the category's answers. Your competitive number.
- Sentiment — of your mentions, how many are positive, neutral, negative. Whether growing visibility is advocacy or criticism.
- Accuracy — whether what the model says about you is true. A confidently wrong price or a discontinued product line can be worse than absence — see fixing AI brand hallucinations.
Every one of these is an estimate from a sample, so each carries a sample size and a 95% confidence interval — or it doesn't get reported.
The DIY spreadsheet recipe
You don't need software to get a real baseline. Here's the honest recipe:
- Write 20–30 prompts from real buyer language — sales calls, support tickets, community threads. Category questions only; your brand name appears in none of them.
- Pick two engines you care about most. Use fresh chats with no memory, or the API, so personalization doesn't contaminate the sample.
- Run each prompt 5 times per engine. Paste every answer into its own row. Yes, it's tedious — that tedium is the honest part.
- Code each answer: were you named? Recommended or just listed? What tone? Any factual errors? Which rivals appeared?
- Compute the rates. Mention rate = answers naming you ÷ total answers. Share of voice = your mentions ÷ all brand mentions.
- Attach the interval. The quick version: ±1.96 × √(p(1−p)/n), where p is your rate and n your answer count. (A Wilson interval behaves better at extreme rates — the companion post has the details.)
- Freeze and repeat. Same suite, same counts, every fortnight. The trend across waves is the product; any single wave is just a data point.
| Column | What goes in it | Example |
|---|---|---|
| prompt_id | Which suite question this answer came from | P07 — "best CRM for a small agency" |
| engine | One engine per row, never mixed | ChatGPT |
| run / date | Run number and when it was collected | 3 of 5 · 2026-08-08 |
| answer text | The full transcript, pasted verbatim | "For a small agency, the three strongest options are…" |
| you_mentioned | 1 if your brand is named anywhere, else 0 | 1 |
| recommended | 1 only if endorsed or listed first | 0 |
| sentiment | Positive / neutral / negative, per a written rubric | neutral |
| errors | Anything false the answer said about you | "names a plan we retired in 2024" |
| rivals named | Every other brand in the answer | Northwind; Bellrose |
This works. For one category on two engines, it's an afternoon per wave, and the number it produces is a genuine measurement — which is more than most "AI visibility" screenshots can claim.
MentionBeat runs this exact sampling design for you — real buyer prompts across up to 6 AI surfaces, repeated runs, and mention rate, share of voice, sentiment and accuracy reported with proper confidence intervals.
Get a free visibility reportWhere tooling earns its keep
The spreadsheet's costs grow with every dimension: more prompts, more engines, more runs, more waves. Hand-coding a few hundred answers is an afternoon; hand-coding a few thousand, fortnight after fortnight, is a job. And human judgment drifts — the person coding "recommended vs. mentioned" in wave one isn't applying quite the same rubric in wave six.
Tooling buys you four things: scale (MentionBeat measures 6 AI surfaces — ChatGPT, Claude, Gemini, Perplexity, Google AI Overviews and Grok), consistency (one versioned rubric applied identically to every answer), statistics (Wilson intervals and change detection computed properly, with honesty labels on every number), and cadence (waves run on schedule whether or not anyone remembered). The honest framing of what that's worth: a tracker that counts mentions is only half the job — the other half is knowing which changes are real and what to publish next.
What no tool can do — ours included — is promise you a mention. Nobody controls these engines. The value is seeing where you stand, with error bars, and what to fix — and the fixes are well-studied: the original GEO research measured visibility gains of up to ~40% from adding citations, quotations and statistics to source content.1
Common traps
- Testing once. The original sin. One prompt, one run, one engine is an anecdote — with variance this high, anecdotes point in whichever direction you feared or hoped.
- One engine only. Engines disagree more than most teams expect. A ChatGPT number tells you about ChatGPT; extrapolating it to "AI search" is a guess dressed as a finding.
- Brand-leading prompts. "Is [your brand] good for small agencies?" measures politeness, not visibility. Category prompts that never name you are the exam that counts.
- Ignoring accuracy. Being mentioned with the wrong price, a dead product line, or a rival's feature attributed to you is not a win. Track what is said, not just whether.
- Editing the suite every wave. Change the questions and you've invalidated every historical comparison. Version the suite; when you must change it, mark the break in your charts.
Frequently asked questions
That tests recall, not visibility. Naming your brand in the prompt guarantees the model talks about you — you're grading your own exam. The measurement that matters is category prompts that never name you: does the engine bring you up on its own when a buyer asks the question your product answers?
Enough that your confidence interval is narrower than the change you want to detect. As a working start: 20–30 prompts, run 5–10 times each per engine, gives a few hundred sampled answers — enough to put a rate on the board with an interval of several points. The sample-size math lets you tune it precisely.
Not to start — the spreadsheet recipe above gives you a real baseline. Tooling earns its keep when scale does: more engines, scheduled re-runs, consistent judging, proper intervals. For a free spot-read right now, the checker audits your page and the AI Overview checker shows whether Google's AI answer cites you for a query — just remember a spot-read is a snapshot, not a trend.
Sources & further reading
- Aggarwal, P., Murahari, V., Rajpurohit, T., Kalyan, A., Narasimhan, K., Deshpande, A. — "GEO: Generative Engine Optimization", KDD 2024 / arXiv:2311.09735.
- Gartner — "Gartner Predicts Search Engine Volume Will Drop 25% by 2026, Due to AI Chatbots and Other Virtual Agents", February 2024.
- Pew Research Center — "Google users are less likely to click on links when an AI summary appears in the results", July 2025.

Head of Research at MentionBeat. Maya leads the measurement methodology behind MentionBeat's visibility metrics — prompt-suite design, sampling, and confidence intervals — and writes about how generative engines choose what to say.