- AI share of voice (SOV) = your brand's mentions ÷ all brand mentions in sampled AI answers to category questions — your slice of the airtime engines give your category.
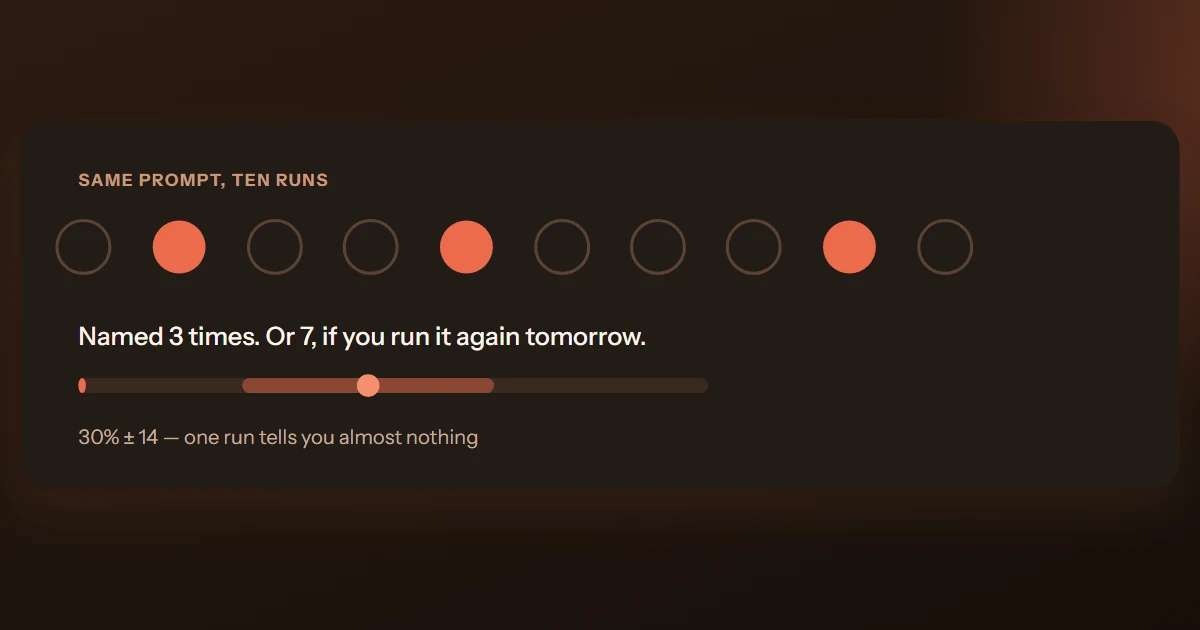
- It's computed from a sample of stochastic answers, so it needs a sample size and a 95% confidence interval — small samples routinely produce "gains" that are pure noise.
- It differs from SEO share of voice in kind, not degree: no search-volume weighting, no fixed results page, and a near zero-sum denominator of two to four named brands per answer.
- Re-measure on a fixed cadence — fortnightly is the default that balances catching engine shifts against collecting a full sample per wave.
Marketers have used share of voice for decades: your slice of the category's advertising, or of its search clicks. AI answers need their own version, because the scarce resource changed. An assistant's answer names two, three, maybe four brands — and buyers increasingly act on that shortlist without clicking further: Pew found users click a traditional result on only ~8% of visits when an AI summary appears, versus ~15% without one,1 while Gartner projected traditional search volume falling roughly 25% by 2026 as buyers shift to assistants.2 Whoever holds the airtime holds the category.
This post pins the definition down, works a full example with the arithmetic visible, and covers the two things that separate a real SOV number from a vanity one: confidence intervals and a consistent re-measurement cadence.
The definition — every word doing work
AI share of voice is your brand's mentions divided by all brand mentions in the sampled answers to your category's prompts. Each part of that sentence carries a rule:
- "Your brand's mentions" — decide entity resolution up front. "Northwind", "Northwind CRM" and "northwind.com" are one brand; apply the same matching rule to every rival. Count mentions, not answers: an answer that names you twice contributes two mentions here (mention rate counts answers — a different metric, defined here).
- "All brand mentions" — the denominator is every brand the engines name, including ones you don't consider competitors. If the assistant keeps recommending a brand you've never heard of, that's information, not an inconvenience.
- "Sampled answers" — a fixed prompt suite, each prompt run multiple times, per engine. Change the suite and you've changed the metric.
- "Category prompts" — questions that never name any brand. Prompts containing your name measure recall, not visibility — you'd be grading your own exam.
And one scope rule: compute it per engine. ChatGPT, Claude, Gemini, Perplexity, Google's AI Overviews and Grok have different corpora and retrieval habits; an average across them hides exactly the differences you need to act on.
A worked example
Suppose you sell a CRM and sample one engine with 30 category prompts × 8 runs = 240 answers. Coding the transcripts finds 520 brand mentions in total — about 2.2 brands named per answer. The split:
| Brand | Mentions | Share of voice |
|---|---|---|
| Northwind | 182 | 35.0% |
| Bellrose | 120 | 23.1% |
| Your brand | 68 | 13.1% |
| Quillstone | 52 | 10.0% |
| Long tail (six more brands) | 98 | 18.8% |
| Total | 520 | 100% |
Illustrative example — the brands and counts are invented; the arithmetic is real.
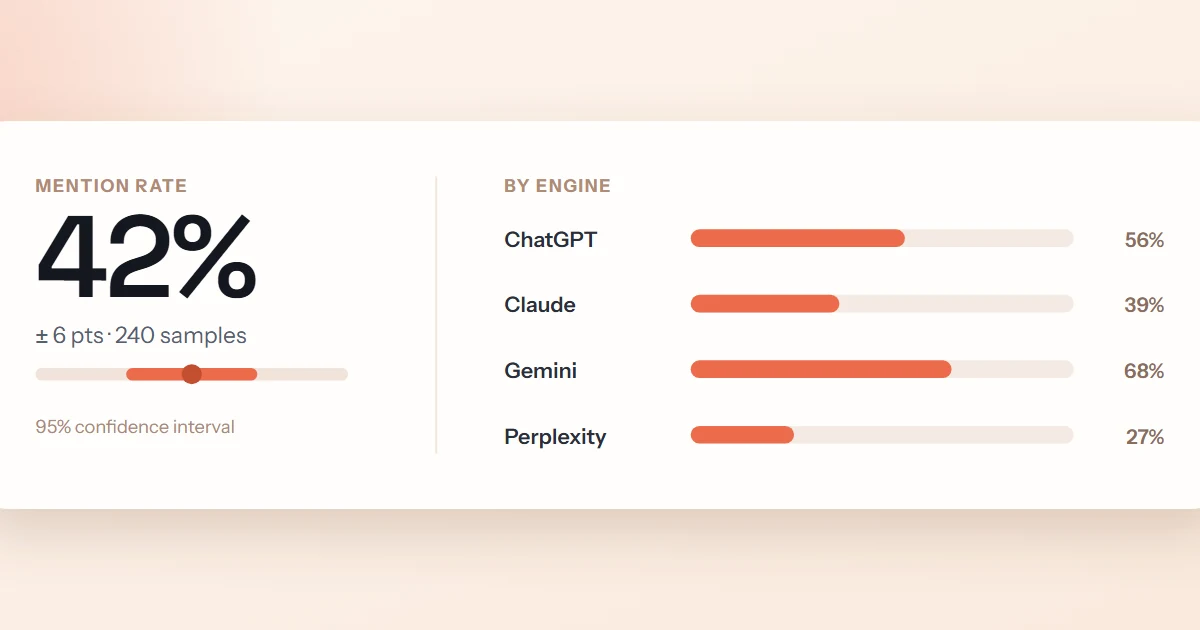
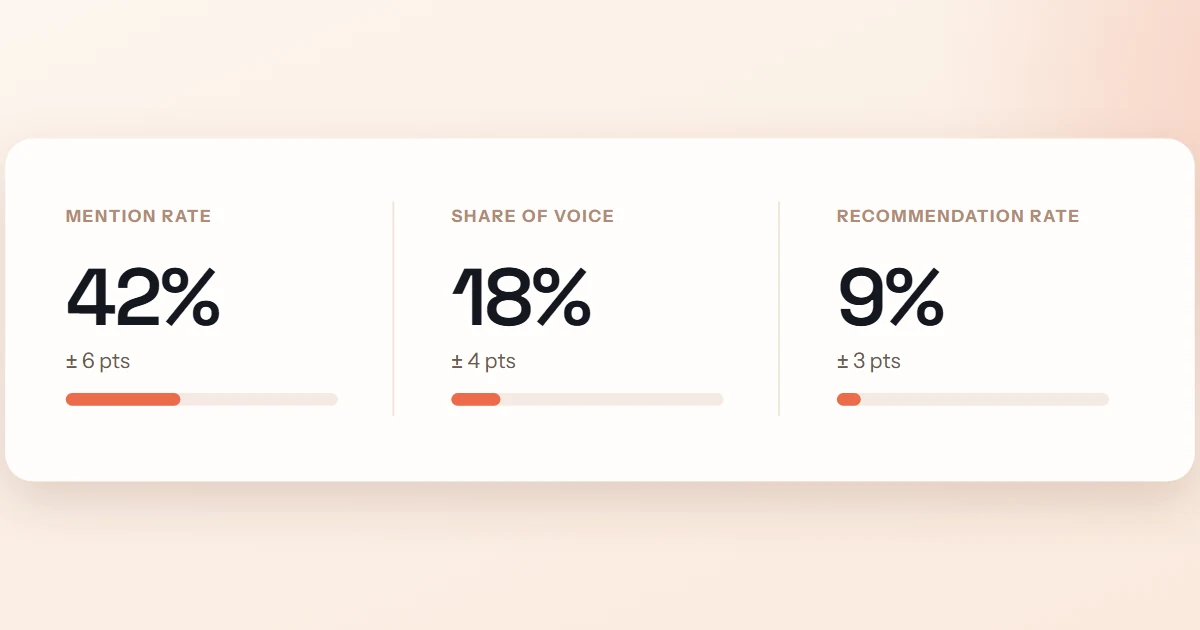
Read it next to mention rate and the story sharpens. Those 68 mentions came from 61 distinct answers, so your mention rate is 61/240 ≈ 25% — you appear in a quarter of answers, but hold only an eighth of the airtime. That gap means you're usually one name on someone else's shortlist, rarely the headline. Two brands — Northwind and Bellrose — hold 58% of the category's voice between them, which tells you exactly whose answers to study in a competitor analysis.
Why confidence intervals matter — small samples lie
That 13.1% is an estimate from a sample, not a census. Run the same wave again and you'd get a different number — the only question is how different. The interval tells you. Treating your share as a proportion of the 520 observed mentions, the quick 95% interval is ±1.96 × √(p(1−p)/n): at p = 0.131 and n = 520, roughly ±3 points. Your honest statement is "somewhere around 10–16%", not "13.1%".
Now shrink the sample, as a hurried wave does. At 100 total mentions the same 13% carries an interval of about ±7 points — wide enough that a "gain" from 13% to 18% between waves is entirely explainable by noise. Teams celebrate that gain, fund the tactic that "caused" it, then watch it vanish next wave. Nothing happened either time except sampling variance.
Two practical rules follow:
- Never compare two waves without intervals. If the intervals overlap heavily, you observed noise. The companion post on confidence intervals covers the math, including why repeated runs of one prompt are correlated and need a cluster-aware interval.
- Size the wave to the decision. Detecting a 5-point shift needs a much bigger sample than detecting a 15-point one. Decide what change matters, then work backwards to prompts × runs.
MentionBeat samples real buyer prompts across up to 6 AI surfaces and reports your share of voice, mention rate and sentiment with 95% confidence intervals — the same statistics behind our published AI visibility index.
Get a free visibility reportHow AI share of voice differs from SEO share of voice
The name carries over; the mechanics don't. SEO share of voice estimates your slice of search clicks from rankings and search volume. AI SOV counts what engines actually say:
| SEO share of voice | AI share of voice | |
|---|---|---|
| What's counted | Estimated clicks or impressions, weighted by keyword search volume | Brand mentions inside sampled AI answers |
| Source of truth | A results page you can fetch — deterministic on any given day | Stochastic answers — the same prompt varies run to run |
| How you observe it | Crawl the SERP | Sample answers, repeatedly, per engine |
| Scarcity | Ten links share page one | Two to four brands share the entire answer — closer to zero-sum |
| Precision | Exact, given the keyword set | An estimate — meaningless without a confidence interval |
| Weighting | Search volume per keyword | Prompt suite design — which is why the suite must mirror real buyer questions |
The last row is the trap. SEO SOV inherits its weighting from keyword-volume data; AI SOV inherits it from whoever wrote the prompt suite. A suite skewed toward questions you happen to win produces a flattering share — which is why the suite is defined from buyer research, frozen, and versioned before anyone looks at a score.
How often to re-measure — and why fortnightly
Share of voice moves when models update, retrieval indexes shift, or the source web changes — none of which happens on your schedule. Measure too rarely and you miss a regression for a month; measure too often and each wave is too thin to trust, which — see above — is how noise gets promoted to strategy.
Fortnightly is the default cadence we recommend (and ship), because it balances the two failure modes: frequent enough to catch engine and retrieval shifts inside a typical model-release cycle, spaced enough that every wave carries a full sample and your published fixes have had time to be crawled and retrieved. Tighten to weekly around a launch or a known model release; loosen to monthly only if your category moves slowly and your budget must. Whatever you choose, keep it fixed — an irregular cadence turns your trend line into a guess about which gaps hid what.
Frequently asked questions
No. Assistants deliberately name several options — a healthy category answer almost always includes rivals, so 100% isn't achievable or even desirable. The realistic goal is to be reliably on the shortlist, ahead of the rivals you actually lose deals to, with a share that grows over waves. And always read SOV next to mention rate: a shifting denominator can move your share while your actual visibility stands still.
No. Share of voice is measured on category prompts that never name any brand. If the prompt says your name, the model will talk about you — that's recall, not visibility, and it inflates your share. Track branded questions separately, as an accuracy check on what the model says when asked about you directly.
There's no universal benchmark, and be suspicious of anyone quoting one — it depends on how concentrated your category is and how many brands engines name per answer. The useful readings are relative: your share versus the leader's, per engine, and the trend across waves. If you want to see what measured category shares actually look like, our AI visibility index publishes them with confidence intervals attached.
Sources & further reading
- Pew Research Center — "Google users are less likely to click on links when an AI summary appears in the results", July 2025 — users click a traditional result on ~8% of visits when an AI summary is present, versus ~15% without.
- Gartner — "Gartner Predicts Search Engine Volume Will Drop 25% by 2026, Due to AI Chatbots and Other Virtual Agents", February 2024.

Measurement Scientist at MentionBeat. Priya designs the statistical machinery behind MentionBeat's metrics — sampling designs, interval estimation and change detection — so that visibility numbers mean what they claim to mean.